Advanced-etl-processor
Pivot
The Pivot transformation consolidates multiple rows of data into a single row, converting a normalized dataset into a less normalized but more compact format by pivoting the input data based on a column value.
For example, a normalized sales report containing shop name, month, and sales amount typically includes multiple rows for each shop, where each row represents sales for a different month. By pivoting the data on the “month” column, the Pivot Transformation produces output with one row per shop. This row displays all sales for that shop, with month names as column headers and sales amounts as corresponding values under those headers.

UnPivoted Data

Pivoted Data
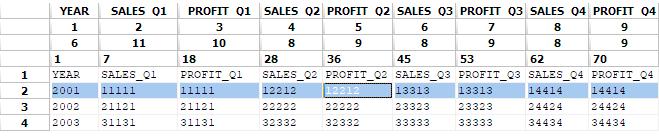
Since there are more than one field to pivot let’s join Profit and Sales fields together first using tab a delimiter than pivot the data and split it again

Joining Data


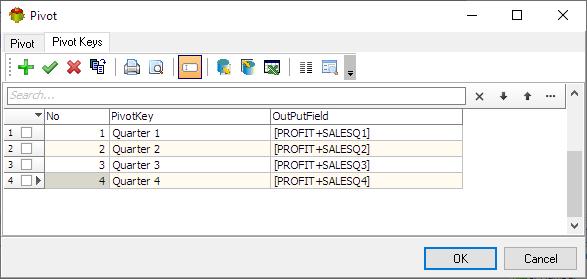
Data after Pivoting

Splitting Pivoted Data

Working with very wide Pivots
Quite ofter it is much easier to prepare pivot mapping in excel and paste it. Here is now:


For more technologies supported by our ETL Software see Advanced ETL Processor Versions
Confused? Ask question on our ETL Forum